ABSTRACT
Although the electronics industry has largely settled on the use of SAC alloys for the assembly of the majority of lead free products, debate continues to exist over which SAC alloy – SAC305 (Sn3.0Ag0.5Cu) or SAC405 (Sn3.8Ag0.8Cu) – to use.
The North American industry generally favours SAC405, while the Asian industry favours SAC305. SAC305 has the significant benefit of being less expensive than SAC405 owing to its lower silver content. However, there are lingering questions about whether the reliability of SAC305 is comparable to that of SAC405. Recent studies have concluded that no significant difference exists, but many potential applications were not studied.
This paper compares the results of reliability testing of SAC305 and SAC405 in three different cases on a test vehicle representative of a mid-complexity server-type product which included a range of component types from CBGAs to discrete resistors. The first case compares the reliability of pure SAC305 assemblies to pure SAC405 on a variety of surface finishes, including ENIG, ImmAg, ImmSn, Electrolytic Ni/Au and OSP. These assemblies differ from those used in many other studies in that SAC305 balled area array components were used on assemblies screened with SAC305 paste, and SAC405 balled area array components were used on assemblies screened with SAC405 paste, resulting in pure SAC305 or pure SAC405 systems. Many previous studies have used area array components balled with SAC405, but increasing use of SAC305 by component suppliers for balling area array components means it can no longer be assumed that BGA components will have SAC405 balls. The reliability of these assemblies was determined in 0°C to 100°C thermal cycling. In the second case, a small sub-set of the assemblies, again, either pure SAC305 or pure SAC405 systems, were tested in harsher -55°C to 125°C thermal cycling more representative of a military or aerospace end-use environment. In the third case, the reliability of mixed assemblies created with either SAC305 or SAC405 balled components and tin/lead paste was studied using the 0°C to 100°C thermal cycle to determine if the difference in composition of the component ball affects the reliability of the resulting assembly.
Key words: Lead Free, SAC 305, SAC405, Mixed Joints
INTRODUCTION
From the earliest days of the electronics industry’s transition towards lead free assemblies, one of the key issues has been which alloy to use in place of the traditional eutectic tin/lead that had been used successfully for so long. Though there are many possible alloys, none could be considered a direct drop-in replacement for tin/lead. Each of the contending alloys had
different benefits and drawbacks, and though many different alloys have been used in manufacturing electronics, near eutectic versions of the tin/silver/copper (SAC) alloy have proven most popular. However, even though the industry has largely settled on SAC, there has been some debate over which composition to use. The North American and European industries tend to favour a composition of SnAg3.9Cu0.7 (commonly referred to as SAC405), while the Asian industry has shown a preference for the SnAg3.0Cu0.5 (also known as SAC305). Recently, there has been an increase in interest in SAC305 in North America and Europe, in large part because its lower silver content makes it less expensive than SAC405. However, though SAC305 has been successfully used for some time, reliability data for SAC305 in higher reliability applications is somewhat limited.
This study aimed to fill this gap by focusing on three key areas of interest for higher reliability applications. These areas were long term reliability under standard 0°C to 100°C thermal cycling, reliability in harsh environments using -55°C to 125°C thermal cycling, and reliability of mixed assemblies, where lead free area array components are assembled with tin/lead solder paste.
The first focus area, 0°C to 100°C thermal cycling, was selected as this profile is preferred by OEMs in many industry segments, including servers and many telecom applications. Though IPC- 9701A1 mandates the use of OSP or ImmAg surface finish on test vehicles for lead free reliability testing, there is a significant interest in the industry in reliability data generated with other lead-free surface finishes. As a result, a range of finishes was included in this portion of the test. These included ImmSn, ENIG, and Electrolytic Ni/Immersion Gold in addition to the recommended OSP and ImmAg.
The second area of focus was on reliability testing for harsh end- use environments, such as those typical of the military and aerospace industries. In these types of environments, the results of 0°C to 100°C thermal cycling are not sufficient to evaluate the reliability of components and solders. A harsher profile, -55°C to 125°C, was selected for this portion of the testing. There is little existing data in this temperature cycling range, but this data is required by military and aerospace OEMs who, facing a growing shortage of tin/lead components, may be considering a transition to lead free assembly.
Issues with availability of tin/lead components are of concern to OEMs in more conventional end-use environments as well. Many OEMs whose products are still covered by exemptions to the RoHS legislation are finding themselves unable to source tin/lead versions of certain components, but are not yet ready to
make the transition to fully lead free assemblies. As a result, it has become necessary to use lead free components in assemblies that use tin/lead paste. For many components, such as those with leadframes or other plated terminals, this is not a significant concern, but for area array components, it can be a major issue. When area array components are used in a mixed assembly process, the solder paste on the board reaches reflow temperatures and melts, but the SAC ball often does not. Instead, it dissolves into the melted solder paste, and depending on the exact conditions, may form a fully or partially mixed solder joint. There are many factors that influence the degree of mixing, one of which is the alloy of the solder ball. Component manufacturers have been using both SAC305 and SAC405 as the alloy for the balls on their BGA components. As a result, it was necessary to investigate the reliability of mixed assemblies formed from components balled with SAC305 and from components balled with SAC405.
Prior to the start of this project, a limited comparison of the reliability of SAC305 to SAC405 had been included in an earlier internal study. The reliability testing from this project did not indicate a significant difference in the reliability of SAC305 and SAC405 for the majority of component types. However, that project had included just one cell of test vehicles assembled with SAC305. The comparison was therefore limited to one surface finish and one accelerated thermal cycling profile. In addition, the joints on these assemblies were not, for the most part, “pure” SAC305 joints. The majority of the area array components used in that study had SAC405 balls, so the resulting joints had a final composition somewhere between SAC305 and SAC405. However, since that time, component suppliers have begun to offer increasing numbers of components with SAC305 balls. A more detailed study which included different surface finishes, different thermal cycling profiles, and components with SAC305 balls was clearly needed to properly compare assemblies using the two alloys.
In order to assess the performance of SAC305 and SAC405, a test vehicle was designed which was representative of a typical mid-complexity telecom or server product. The test vehicle, known as RIA3, was 8” x 10” in size, and was 0.093” thick and is shown in Figure 1. It was sourced in a variety of surface finished to determine if varying the finish had a significant effect on the reliability of the solder joints. The test vehicle included a wide range of components, including ceramic BGAs, plastic BGAs, LGAs, QFPs, MLFs and discrete resistors ranging in size from 1206s to 0201s. All of the area array components for this test vehicle were sourced in both SAC305 and SAC405 versions. This allowed for the assembly of test vehicles where the area array solder joints were composed of pure SAC305 or pure SAC405.
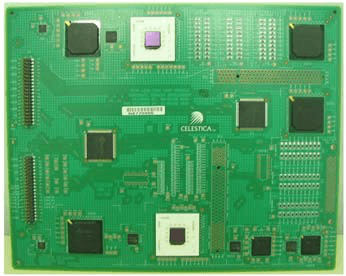
Figure 1: “RIA3” Test Vehicle
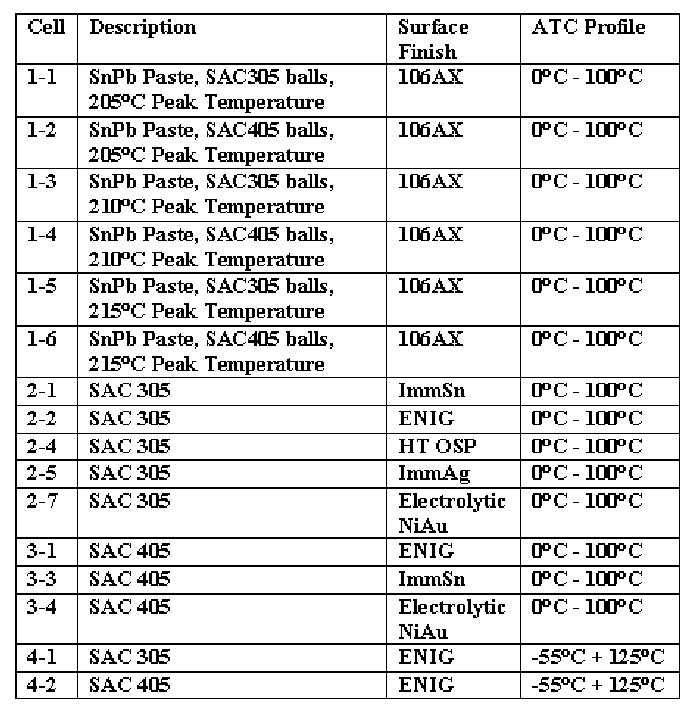
The RIA3 test vehicle was used to evaluate a number of different aspects of lead free manufacturing – the comparison of SAC305 to SAC405 involved data from 16 of the project’s cells. Each of the cells consisted of 17 boards – one for time zero analysis of the solder joints, and 16 for accelerated thermal cycling. Each test vehicle included two of each component type, making a total sample size of 32 components per cell. A summary of the cells referenced in this paper is shown in Table 1.
Table 1: Test Cells Comparing SAC305 to SAC405
Accelerated thermal cycling was conducted in accordance with IPC-9701. Prior to the start of thermal cycling, all the test vehicles were subjected to 5 cycles of thermal shock preconditioning intended to simulate the worst case thermal excursions experienced as a result of shipping. The thermal shock preconditioning was carried out in a dual zone thermal shock chamber with temperature extremes of –40°C and 65°C and 30 minute dwells. Following the preconditioning, the cards from Cells 4-1 and 4-2, which used the harsh -55°C to 125°C profile, were placed together in one chamber for thermal cycling. The cards from all remaining cells were randomly allocated to one of six thermal cycling chambers. Each of the chambers was profiled to meet the requirements of IPC-9701’s preferred 0°C to 100°C cycle condition. Total test duration was 3000 cycles for the harsh test, and 6000 cycles for the standard 0°C to 100°C test. The cards in all chambers were mounted into racks which maintained spacing between them to allow the air to circulate freely. Figure 2 shows the cards mounted inside one of the chambers.
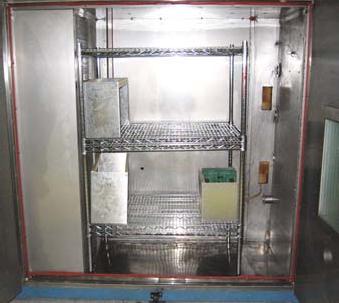
Figure 2: RIA3 Test Vehicles in Thermal Cycling Chamber
All of the test vehicles were fully in-situ monitored by dataloggers. A failure was defined as five consecutive readings showing a 20% increase in resistance over the maximum resistance reading recorded during the first thermal cycle. The tests were stopped periodically to allow the failures to be verified using a multimeter and the precise failing locations to be identified.
Though the 0°C to 100°C cells contained a wide variety of component types, not all of them had accumulated a sufficient number of failures by the time of writing to allow a Weibull plots to be generated. One component which did have a sufficient number of failures was the CBGA component. The CBGA on the RIA3 test vehicle was a 937 I/O, 1mm pitch CBGA. The cells using SAC305 paste were assembled using CBGAs balled with SAC305, and the cells using SAC405 paste were assembled using CBGAs balled with SAC405. Weibull plots comparing the performance of the CBGA on ImmSn, ENIG and Electrolytic Ni/Immersion Au are shown in Figures 3 through 5. For the remaining finishes, OSP and ImmAg, there was no SAC405 cell assembled, making comparison impossible.
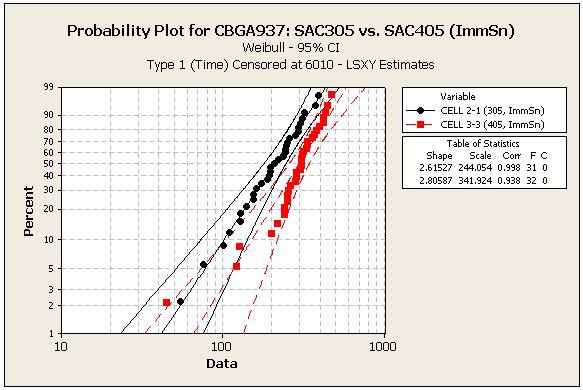
Figure 3: SAC305 vs. SAC405 CBGA on ImmSn in 0°C to 100°C Thermal Cycling
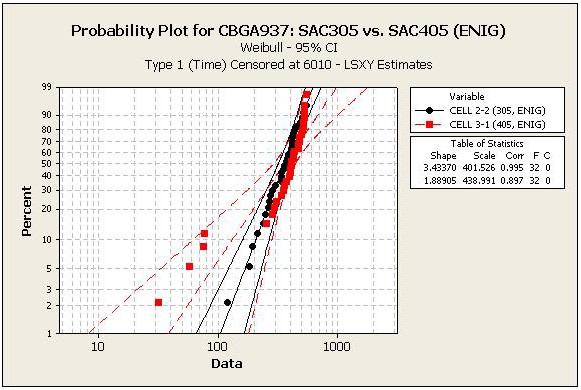
Figure 4: SAC305 vs. SAC405 CBGA on ENIG in 0°C to 100°C Thermal Cycling
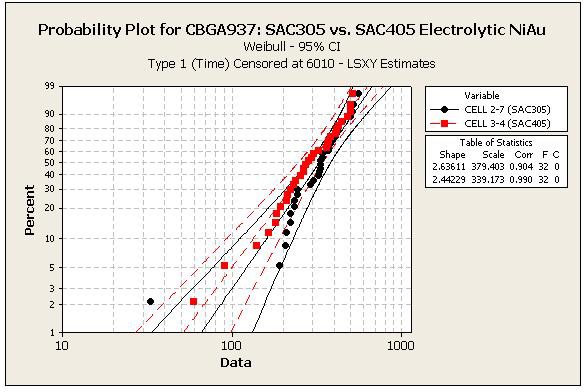
Figure 5: SAC305 vs. SAC405 CBGA on Electrolytic NiAu in 0°C to 100°C Thermal Cycling
The difference between SAC305 and SAC405 was most pronounced on the ImmSn finish. On ImmSn, there was a difference in performance between SAC305 and SAC405 at N63%, with the SAC405 outperforming the SAC305. However, at lower failure levels, the difference is no longer statistically significant. On ENIG and Electrolytic NiAu, there was no significant difference in performance between the two alloys.
In each case, a small number of early failures were observed. These were attributable to premature second level solder joint cracks caused by poor solder mask registration. In some cases, this resulted in solder mask encroaching on the surface of the pad, resulting in pads which were, in effect, partially solder mask defined. The pads had been intended to be fully non- solder mask defined. The solder mask encroachment changed the shape of the solder joint and formed an area of concentrated stress. Cracks initiating from the solder mask contact propagated across the joints and caused failures, some of them very early. A typical crack showing solder mask encroaching on the pad is shown in Figure 6.
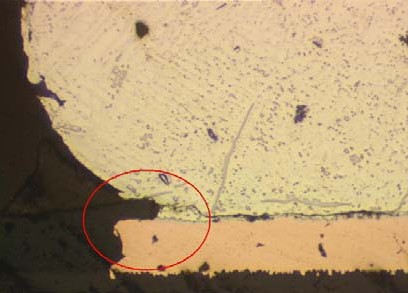
Figure 6: Crack Resulting from Solder Mask Encroaching on Pad
Three crack paths were observed for both the SAC305 and SAC405 components. The first, the board side solder joint crack, was found to be responsible for many of the early failures observed. It was also found on some joints with more normal numbers of cycles to failure, and in many cases was associated with some encroachment of the solder mask onto the component pad. The crack propagates through the bulk solder above the pad. A typical example of this failure mode is shown in Figure 7.
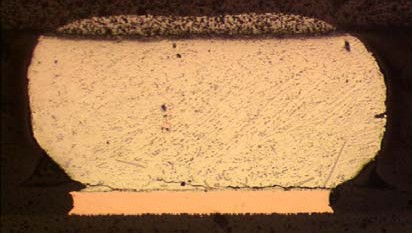
Figure 7: Typical Board Side Solder Joint Crack
The second crack path was the component side solder joint crack. This is the commonly expected failure mode for these components when the solder mask is not partially encroaching on the board side pad. As with the board side failure mode, the crack propagates through the bulk solder. A typical example is shown in Figure 8.
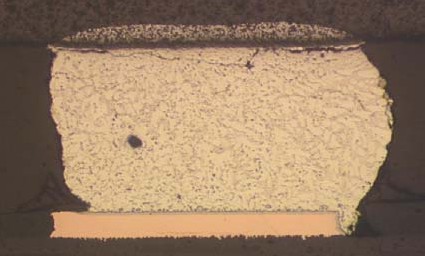
Figure 8: Typical Component Side Solder Joint Crack
Although the vast majority of the components had either board side or solder joint cracks, a small number had a diagonal crack path. These cracks did not result in complete failures of the solder joint. In this crack path, one crack grows diagonally towards the centre of the joint from the component side, and a second crack grows diagonally towards the centre of the join from the opposite end of the board side pad. Figure 9 shows an example of this crack path.
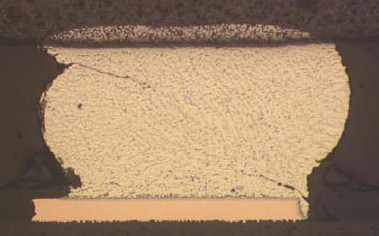
Figure 9: Diagonal Crack Path
Comparison of the joint structures was also carried out. Figure 10 shows a SAC305 joint and a SAC405 joint side by side. In general, the SAC305 joints were found to have larger tin dendrites than the SAC405 joints. No Ag3Sn needles were observed in the SAC305 joints, but did appear in the SAC405 joints – this was expected due to the higher silver content of the SAC405 paste(check ref.4 in Polina’s paper).

Figure 10: SAC305 Joint (Left) and SAC405 Joint (Right) on ImmSn
ATC RESULTS FOR -55°C to 125°C THERMAL CYCLING
Though many components were included in the harsh environment testing, the discussion will focus on the PBGA196, as this was one of the few component types to generate sufficient numbers of failures to allow a comparison of the performance of the SAC305 and SAC405 joints to be made. The Weibull plot for the PBGA196 is shown in Figure 11. The SAC405 joints can be seen to outperform the SAC305 joints, with a statistically significant difference in the performance at the critical N1% level. At higher levels of failure (including at N63%, the characteristic life) the difference is no longer visible. However, in field applications, the difference in performance at low levels of failure is of critical importance. Figure 12 shows the number of cycles to 1% failure (N1%). At this level, the performance of SAC405 is approximately 1.7X better than SAC305.
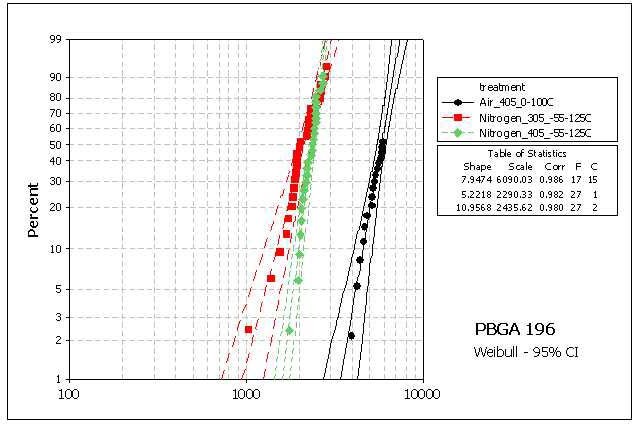
Figure 11: Weibull Plot, SAC305 vs. SAC405 for PBGA196 in
–55°C to 125°C Thermal Cycling
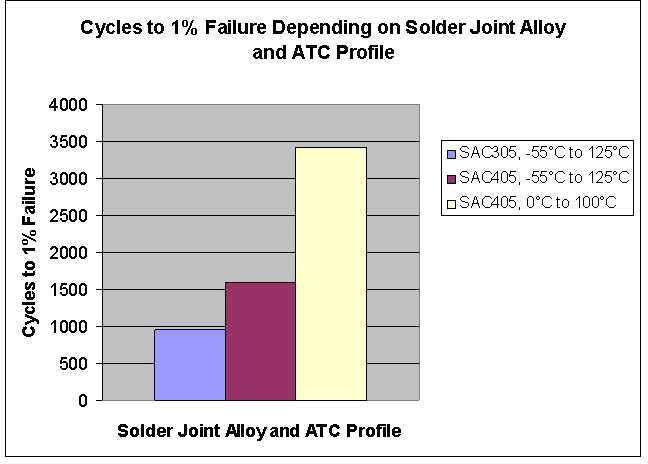
Figure 12: N1%, SAC305 vs. SAC405 for PBGA196 in –55°C
to 125°C Thermal Cycling
Failure analysis reveals that the failure mode for both the SAC305 and SAC405 PBGA196 joints was the same – cracks through the bulk solder on the component side of the joints. These cracks occurred most frequently at the balls under the die corners – E5, E10, K5 and K10 – for both SAC305 and SAC405.
As with the 0°C to 100°C results, the mixed assembly cards had not yet completed 6000 cycles at the time of writing. However, the PBGA196 had accumulated enough failures to allow the SAC305 and SAC405 assemblies to be compared to each other.
The mixed assembly experiment studied the degree of mixing and reliability of joints formed using three different reflow profiles. Two cells were assembled using each reflow profile – one using tin/lead paste and components with SAC305 balls, and the other using tin/lead paste and components with SAC405 balls. The first profile had a target peak temperature of 205°C, with a target time above reflow of 120 seconds, the second had a target peak temperature of 210°C with a target time above reflow of 80 seconds, and the third profile had a target peak temperature of 215°C with a target time above reflow of 100 seconds.
Time zero analysis of the SAC305 and SAC405 assemblies showed differences in the degree of mixing of the PBGA196 joints between the SAC ball and the SnPb paste. This was done by performing a cross section along the component’s diagonal axis and visually assessing the degree of mixing obtained. Figure XX shows examples of partially mixed and fully mixed joints from two of the other component types on the board – a CSP64 and a PBGA256. Table 2 summarizes the results for degree of mixing. Generally, it is expected that the degree of mixing would increase with increasing reflow profile peak temperature. However, this trend did not show clearly in this data. Upon review of the reflow profile, it was discovered that the profile with a target peak temperature of 210°C used for Cells 1-3 and 1-4 was actually somewhat colder than the profile used for Cells 1-1 and 1-2, which was intended to have a peak temperature of 205°C. This profiling error accounts for the lower degree of mixing observed for Cells 1-3 and 1-4 when compared to Cells 1-1 and 1-2.
Table 2: Degree of Mixing for Mixed SnPb/SAC PBGA196 joints
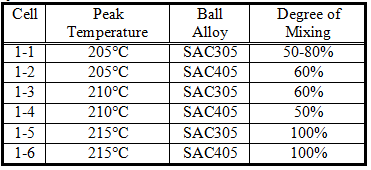
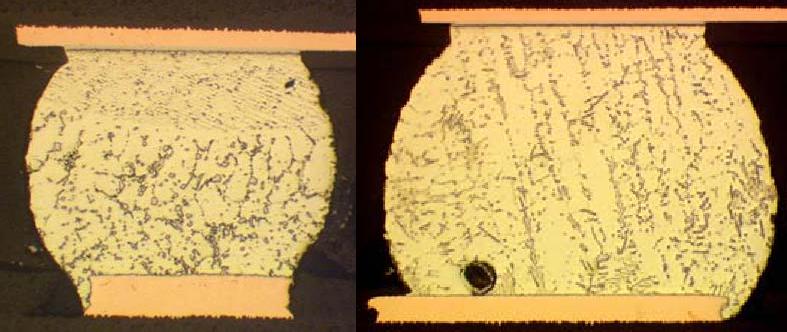
Figure XX: Partially Mixed CSP64 Joint (Left) and Fully Mixed PBGA256 Joint (Right)
Following the completion of thermal cycling, which used the standard 0°C to 100°C profile, an event plot was generated to show the relative performance of the mixed assembly cells. As there were insufficient failures in some cells, meaningful Weibull plots could not be generated for comparison. The event plot is shown in Figure XX.
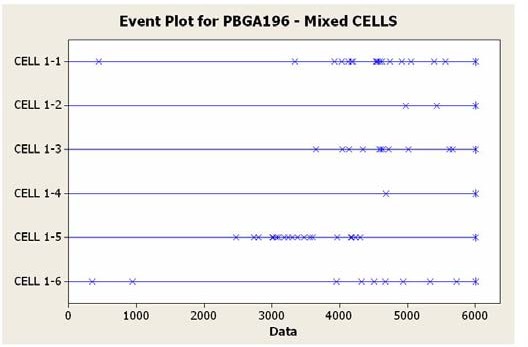
Figure XX: Event Plot for Mixed PBGA196 Joints after Thermal Cycling
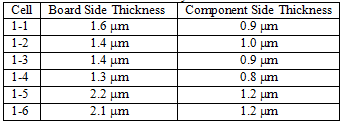
Two main trends were uncovered in analyzing the data. The first trend is a decrease in reliability with increasing peak temperature. Full mixing was not required to create reliable solder joints – in fact, the partially mixed joins created with the two cooler profiles actually produced joints that outperformed the fully mixed joints. Intermetallic thickness measurements were performed on the time zero cross section samples, and these confirmed that the intermetallic layer thickness increased with increasing profile temperature (it must be recalled that the 210°C profile was, in fact, the coolest due to a profiling error). The intermetallic layer thickness measurements are shown in Table 3.
Table 3: Time Zero Intermetallic Layer Thickness Measurements for Mixed Assembly Cells
In addition to the increase in intermetallic layer thickness with increasing peak temperature, there were slight differences observed in the microstructure of the time zero samples, with the grain structure coarsening somewhat with increasing peak temperature. These differences may account for the difference in performance observed during reliability testing.
The second trend relates directly to the difference in performance of SAC305 and SAC405. It was observed that the joints formed from components with SAC405 balls (Cells 1-2, 1- 4 and 1-6) outperformed those formed from components with SAC305 balls (Cells 1-1, 1-3 and 1-5) using each of the three reflow profiles. Though it is not possible to determine whether the difference is statistically significant due to the inability to generate proper Weibulls for the cells with low numbers of failures, the difference in performance between joints formed from the two alloys at a given temperature is marked.
Failure analysis further confirmed these differences. Though the failure mode (component side cracks through the bulk solder)
was the same for both the SAC305 and SAC405 based mixed joints, there was a difference observed in the extent of cracking. For the fully mixed cells (1-5 and 1-6), the solder joints from Cell 1-6, which were based on SAC405 balled components, showed only partial cracks in the solder joints. These cracks propagated at most 50% of the way through the solder joint. In the SAC305-based joints, full solder joint cracks were observed.
Similarly, in the partially mixed joints from Cells 1-1 through 1- 4, the same failure mode was observed for both SAC305 and SAC405 based joints. In this case, the joints propagated through the bulk solder in the unmixed region on the component side. The same trend in the extent of cracking from the fully mixed joints was also observed on the partially mixed joints. No fully cracked SAC405 based joints were found – partial cracks did exist in the pure SAC405 region of the joint. In the SAC305 based joints, full cracks through the remaining SAC305 region were observed.
MICROSTRUCTURE DIFFERENCES BETWEEN SAC305 AND SAC405
Reliability testing for all three cases has shown a difference in performance between SAC305 and SAC405 in all three cases. Though the difference is not always statistically significant, SAC405 appears to consistently outperform SAC305 in all three cases. Microstructural analysis was conducted to determine possible causes for this difference in performance.
Pure SAC Joints
Differences were observed in the microstructure of pure SAC305 and pure SAC405 solder joints. One significant difference is the
Mixed Joints
Mixed solder joints may be divided into two categories: fully mixed, and partially mixed.
At time zero, the fully mixed microstructure consists of primary Sn dendrites, with ternary Sn-Pb-Ag3Sn eutectic and quaternary Sn-Pb-Ag3Sn-Cu6Sn5 eutectic. This structure may be seen in Figure XX. The partially mixed time zero microstructure shows a fully mixed region in the lower portion of the joint with the same microstructure as the fully mixed joints, and a region of pure SAC305 or SAC405 remaining at the top of the joint.
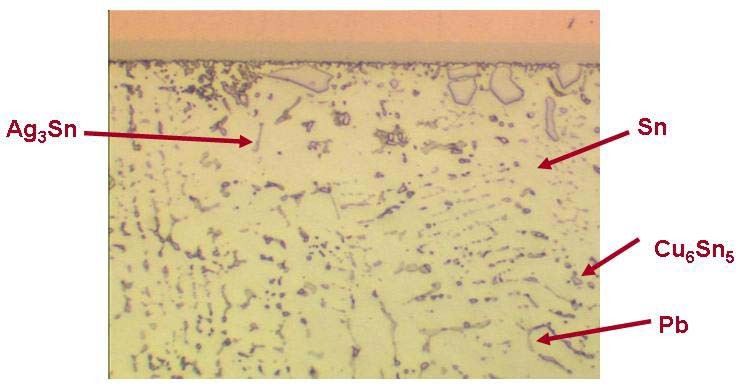
Figure XX: Detail of the microstructure of a fully mixed PBGA196 solder joint
Detailed analysis of the fully mixed microstructure following the completion of ATC shows a slight difference in the microstructure of mixed joints formed from components balled with SAC305 and components balled with SAC405. The mixed joints formed from SAC305 generally had larger grains than those formed from SAC405. In addition, the SAC305-based mixed joints had fewer intermetallic particles than the SAC405- based joints, and the intermetallics that were present in the SAC305-based joints were spaced further apart. Figure XX shows the microstructure of fully mixed joints created from SAC305 and SAC405.
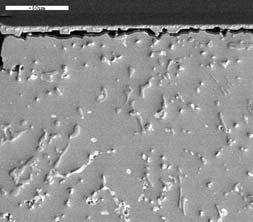
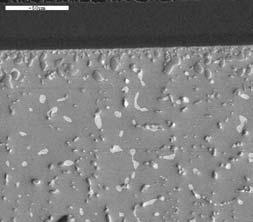
Figure XX: Microstructure of fully mixed solder joints based on SAC305 (left) and SAC405 (right), 600X Magnifications
Though the exact failure mechanism for the fully mixed solder joints is not known, it is thought that the finer grain size of the SAC405 based mixed joint microstructure could explain why it outperforms SAC305 based joints, as the finer structure of the SAC405 based joints would coarsen more slowly under stressed imposed by thermal cycling. The reinforcing effects of the additional intermetallic particles in the SAC405 based joints could also contribute to their improved performance.
For the partially mixed solder joints, the failure analysis had shown that the solder joints ultimately failed due to cracks propagating through the remaining region of pure SAC305 or SAC405 at the component side of the solder joint. In this case, the microstructure of pure SAC305 and pure SAC405 described in the previous section would influence the difference in performance in ATC testing.
CONCLUSIONS
Though in many cases the difference between SAC305 and SAC405 was small, and not always statistically significant, it was observed that SAC405 generally outperformed SAC305 joints. Under 0°C to 100°C thermal cycling, no statistically significant difference between SAC305 and SAC405 was observed at the N1% failure level. Under harsh environment testing, SAC405 joints were significantly better than SAC305 joints, lasting 1.7X longer at the N1% level. Mixed joints based on SAC405 showed very few failures, and had a much lower extent of cracking than mixed joints based on SAC305. Due to the low level of failures in some of the mixed assembly cells, it was not possible to determine if they were statistically different, although the difference appears marked. It is important to note that in each case, the failure mode for SAC305 and SAC405 joints was the same.
These results indicate that for many applications, SAC305 and SAC405 both have acceptable reliability. However, for high reliability applications, the additional margin of reliability provided by SAC405 makes it a better choice. Care must also be exercised in mixed assembly, where a potentially significant difference in reliability exists. Where possible, components balled with SAC405 are preferred for mixed assembly.
FUTURE WORK
To more fully understand the differences in performance between SAC305 and SAC405, the existing testing for pure SAC305 and 405 assemblies and mixed assemblies based on SAC305 and SAC 405 in 0°C to 100°C thermal cycling must be completed to allow trends on remaining component types to be studied.


Contact: Tommy
Phone: +86 13691605420
E-mail: tommy@flason-smt.com
Add: No.94,Guangtian Road,Songgang Street,Bao an District Shenzhen China